Data Analysis
As Historical Archaeologists, we regularly use historic documents in conjunction with our excavations to help us understand the past. The lists such as those used to create the database may be some of the only documents to give us the names and ages of those enslaved at plantations like Wye House. The analysis below, conducted by Benjamin Skolnik, is an example of the kind of information that we can derive from these documents.
While the database has great potential as a genealogical tool, it can also be used to better understand American plantation slavery and the creation of a uniquely African American culture. Inspired by the groundbreaking work of Lorena Walsh at Carters Grove, we have used the database to understand how the enslaved community at Wye House grew into a true community. The research presented below represents a small project done using the database. As always, we welcome your comments and encourage you to actively engage with the informationboth below and in the databasethat we have made publicly available.
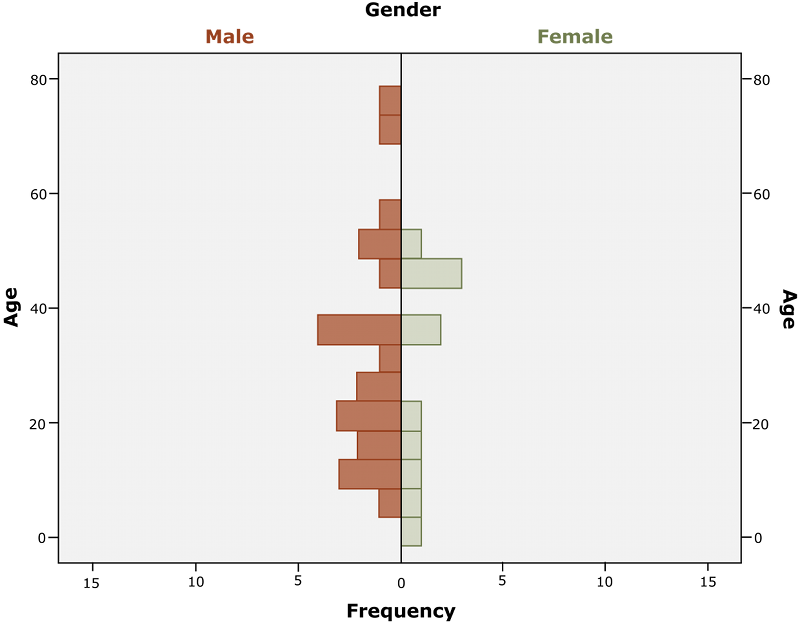
Figure 1. Enslaved Population in 1770 by age and gender.
During much of the 17th and 18th centuries, the enslaved population in the British-colonized North America was largely not self-sustaining. That is, there were more deaths than births and in order maintain the enslaved workforce, enslaved Africans had to be brought from Africa continuously. When deciding which slaves to purchase for their plantations during this time, plantation owners would frequently favor young men, approximately between 15 and 30 years old, as they could be expected to labor for many years and would be the best investment. These men form a stable labor base for the plantation for many years until with age, they become less productive workers. To replace this aging population, the plantation owner must buy a new cohort of productive, young, male laborers. According to Walsh the clusters in the 1770 census between the ages of 15-25, 35-40, 45-55, and 70-80 may largely represent these African cohorts, purchased as the cohort above became less physically less productive. While this is not to say that there are no American born slaves at Wye House in 1770, the major force driving the demographic distribution in this population seems to be the importation of new enslaved laborers.
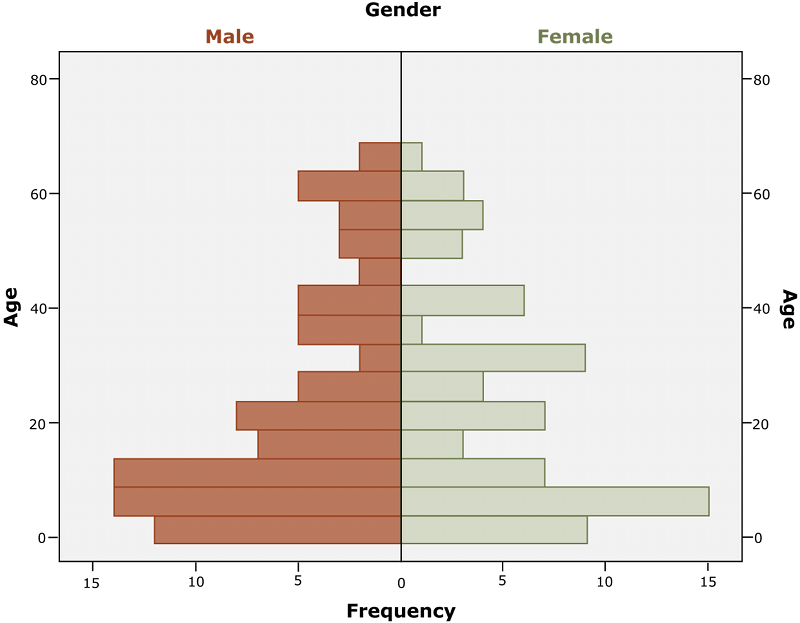
Figure 2. Enslaved population in 1826 by age and gender.
The censuses at Wye House reveal this historical trend as well. Figure 2 shows the ages and genders of those enslaved on the plantation in 1826. Not only are males and females roughly equally distributed, but the age distributions is much closer to what one would expect to find in a naturally-reproducing population. While there are certainly African-born slaves present in 1826 (as Douglass reminds us), this pattern is not one that is created by purchasing cargos of enslaved individuals.
The consequence and importance of this transition between the demographics of the enslaved population in 1770 and 1826 cannot be overstated. In 1770, we see evidence of a group of people who were purchased explicitly to work on a plantation and were replaced as they became inefficient. Because of the clusters of age cohorts and because of the surplus of working age men, one can argue that many of these individuals were brought directly from Africa. By 1826, this pattern is gone and in its place, we see one that makes us picture a self-sustaining community with its own history, memory, and culture.
The database is also useful in that it tracks many of the same people through time. Below are the population distributions from the 1770, 1792, 1805, and 1826. Note that the cluster of 10-25 year olds in 1770 appear again as a cluster of 25-40 year olds in 1792, again as a cluster of 35-50 year olds in 1805, and again as a cluster of 55-70 year olds in 1826. From the censuses, we can track this group from childhood to adulthood and into old age.
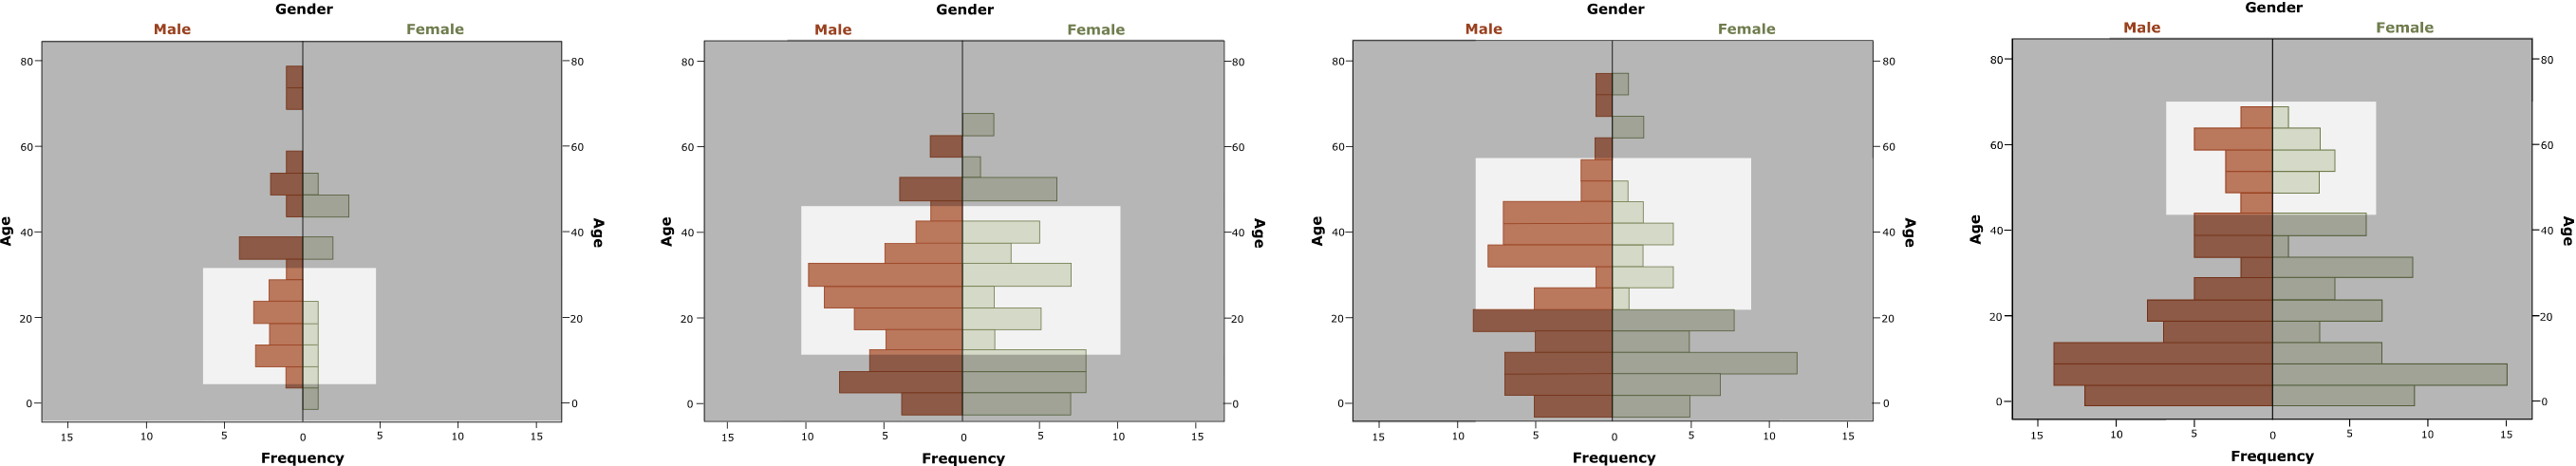
Figure 3. The enslaved populations in (from left to right) 1770, 1792, 1805, and 1826.
This group is of particular note because when Douglass writes of those enslaved at Wye, these are the elders in that community. He writes, Strange, and even ridiculous as it may seem, among a people so uncultivated, and with so many stern trials to look in the face, there is not to be found, among any people, a more rigid enforcement of the law of respect to elders, than they maintain. These are those individuals in Douglass community that possess familial knowledge and represent a physical connection to the past.
This research only represents the beginning of our use of this database to better understand plantation slavery on Marylands Eastern Shore. In the future, we plan on tracking individuals as they appear throughout multiple censuses, reconstructing family histories where possible, working backward from the 1770 census to estimate the enslaved population of Wye House in 1750 or earlier, and working forward from the 1826 census and use the 1850 census to include the enslaved population at mid-century.
For more information on this type of analysis, see:
Walsh, Lorena S.
1997 From Calabar to Carters Grove: The History of a Virginia Slave Community. University of
Virginia Press.